Boston Sports Trends
February 24, 2014
Things have been pretty good for the local teams over the past 13 years. The Patriots and Red Sox have won
a combined six championships since January 2002. After some lean years, the Celtics and Bruins both won
championships and made multiple finals appearances in the past six years.
I wanted to quantify the successes and failures of our local teams through the years so I looked at
winning percentages and playoff success between 1975 and 2013. FYI: Football and basketball seasons were
assigned to the calendar year in which they ended while football seasons were assigned to the year in which
they started. Baseball, of course, starts and ends in the same calendar year. Here are the results:
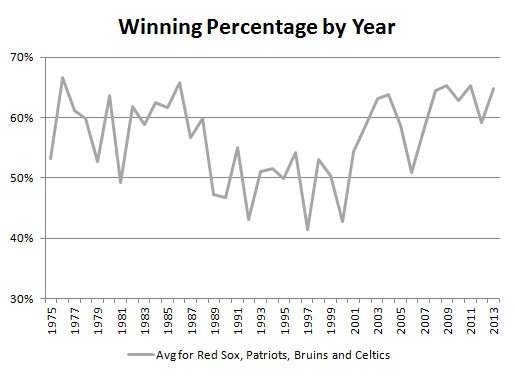
- In terms of regular season winning percentage, the best year was 1976. The four Boston pro teams
combined for a winning percentage of .666 that year as the Pats, Celtics and Bruins each won more than 65%
of their games. A memorable 1986 was second with an average winning percentage of .658. 2009 and 2011 came
in tied for third with a combined winning percentage of .653. Seven of the ten best years since 1975 have
come since 2003.
- The worst year for the four Beantown teams was 1997. Boston teams had an average winning percentage
of only .415 that year. Only the Patriots finished over .500 that season. The year 2000 was the second worst
season (.427) and 1992 was the third worst (.431).
- Three of the four Boston teams finished in first place in their division in a single calendar year
only three times in the past thirty years (1976, 1986 and 2009). At least one Boston team finished first in
35 of the last 39 years.
- During the 1980s, Boston teams advanced to the finals eight times and won three championships (all by
the Celtics). Only two teams advanced to the finals in the 1990s (Bruins in 1990 and the Patriots at the
end of the 2006 season). Boston has advanced to the finals 12 times between 2001 and 2013, winning eight
championships. The 1980s winning percentage was .593 as compared to .554 for the 2000s and .500 in the 1990s.
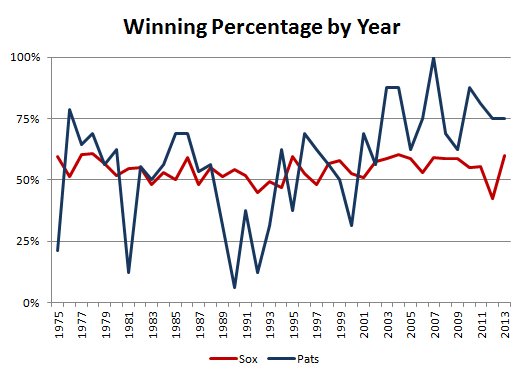
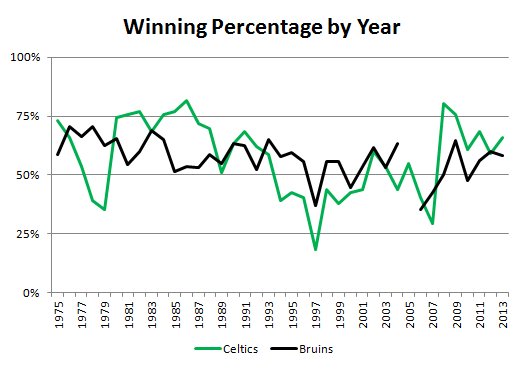
- The Bruins were the most consistent team, finishing above .500 in 32 of 39 seasons between 1975 and 2013.
The Bruins finished above .500 in every season between 1967-68 and 2003-04 (37 seasons). Sadly, they only
won the Cup in two of those years. The Red Sox are a close second with 31 seasons above .500 since 1975.